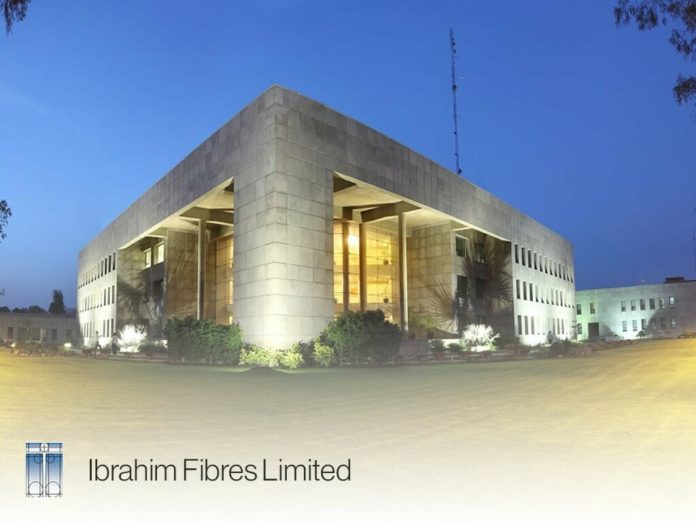
ISLAMABAD (ABC) – The Ibrahim Fibres Limited’s net sales grew by 3.62% but its net profit dipped by 94.28% in CY23, compared to the calendar year 2022, reports WealthPK.
During the calendar year 2023, the company observed net sales of Rs119.7 billion and net profit of Rs303.5 million.
Its gross profit plunged by 33.58% to Rs8.96 billion in CY23 from Rs13.5 billion in CY22. Thus, the gross profit margin sliped to 7.49% during the review period from Rs11.68% in CY22.
| Ibrahim Fibres Limited – Profitability -CY22 vs CY23 | |||
| Particulars | CY22 | CY23 | Percentage Change |
| Net Sales | 115,581,019,592 | 119,761,927,341 | 3.62% |
| Gross Profit/Loss | 13,502,566,887 | 8,967,902,565 | -33.58% |
| Gross Profit/Loss margin % | 11.68% | 7.49% | |
| Expenses | -3,895,607,487 | -5,228,829,261 | 34.22% |
| Profit before taxation | 9,951,296,307 | 3,821,719,837 | -61.60% |
| Net Profit/Loss after tax | 5,310,545,301 | 303,503,346 | -94.28% |
| Net Profit/ Loss margin % | 4.59% | 0.25% | |
| Earnings/Loss per share (EPS) | 17.1 | 0.98 | |
Overall, the expenses of the company grew by 34.22% in CY23, in which the finance costs surged to Rs2.002 billion from Rs634.8 million in CY22. Additionally, the company’s selling and distribution expenses and administrative expenses expanded marginally.
However, other operating expenses contracted to Rs290.7 million during the review period. In CY23, the profit before tax fell considerably by 61.60% to Rs3.82 billion from Rs9.95 billion.
Resultantly, the net profit margin and earnings per share (EPS) reduced to 0.25% and Rs0.98 in CY23.
Profitability ratios
The company’s profitability ratios followed a similar pattern over the four years. In 2020, the company registered a gross profit to sales of 4.1%, but suffered a net loss to sales of 1.8% and a loss per share of Rs4.2.
| Ibrahim Fibres Limited- profitability ratios | ||||
| Particulars | 2020 | 2021 | 2022 | 2023 |
| Gross profit to sales (%) | 4.1 | 17.7 | 11.7 | 7.5 |
| Profit / (loss) before tax to sales (%) | -1.8 | 13.4 | 8.6 | 3.2 |
| Earnings per share (Rupees) | -4.2 | 21.2 | 17.1 | 1 |
The year 2021 turned out to be a favorable year for the company in terms of higher profitability ratios. The company managed to earn a net profit-to-sale ratio of 13.4% and EPS of Rs21.2 with a gross profit to sales of 17.7%.
However, in the subsequent years, the profitability ratios continued to decrease. The company registered gross profit to sales of 7.5%, net profit to sales of 3.2%, and EPS of Rs1 in 2023, indicating weak management of operations during the period.
Assets, Equity, and Liabilities Analysis
Despite the decline in profitability of the company, the non-current asset moderately increased by 2.09% to Rs39.6 billion in 2023 from Rs38.8 billion in 2022.
This suggests that the company has invested in long-term assets such as property, equipment, and intangible assets, reflecting its objective to expand its business by modernization efforts or strategic acquisitions.
The current assets grew by 11.56% between the period under consideration from Rs44.2 billion in 2022 to Rs49.31 billion in 2023. This shows the increase in short-term assets of the company such as cash, accounts receivable, and inventory.
| Ibrahim Fibres Limited – Assets, Equity, and Liabilities – 2022 Vs 2023 | |||
| Particulars | 2022 | 2023 | Percentage Change |
| Non-current Assets | 38,873,168,582 | 39,683,724,382 | 2.09% |
| Current Assets | 44,203,756,408 | 49,313,840,773 | 11.56% |
| Share capital and reserves | 54,450,433,555 | 54,649,796,599 | 0.37% |
| Non-Current Liabilities | 10,046,202,596 | 12,635,911,631 | 25.78% |
| Current Liabilities | 18,580,288,839 | 21,711,856,925 | 16.85% |
The company’s share capital and reserves grew slightly by 0.37% in 2023. At the end of 2023, the company’s non-current liabilities reached Rs12.6 billion compared to Rs10.04 billion in 2022, reflecting a growth of 25.78%.
This signifies that the company has taken more long-term obligations to finance the capital investments and other expenses.
The company’s current liabilities rose by 16.85% to Rs21.7 billion in 2023 from Rs18.5 billion in 2022. Short-term obligations include short-term loans, accounts payable, and other current liabilities.
Synthetic and Rayon Sector
In the Synthetic and Rayon sector, Ibrahim Fibres Limited managed to secure the highest 82% of the total outstanding shares and Image Pakistan Limited the lowest with 1% of market capitalization.
Market capitalization assesses the total market value of a company’s outstanding shares.
| Synthetic and Rayon Sector – Profitability – 2023 | |||
| Company | Symbol | MARKET CAP | ESP |
| Image Pakistan Limited | IMAGE | 1,648,130,310 | 1.91 |
| Pakistan Synthetics Limited | PSYL | 3,086,052,750 | 5.75 |
| Ibrahim Fibres Limited | IBFL | 114,887,588,150 | 1.00 |
| Gatron (Industries) Limited | GATI | 20,549,773,440 | 2.68 |
EPS measures a company’s profit per share of outstanding shares. In terms of EPS, Pakistan Synthetics Limited is the most profitable company in the Synthetic and Rayon Sector, with an EPS of Rs5.75, and Ibrahim Fibres Limited is the least profitable with an EPS of Rs1.00 in 2023.
Future Outlook
The company is optimistic to achieve better results by adopting cost efficient polices and effective inventory management, despite the high inflation, surged energy prices, persistent increase in interest rate, and taxarion.
Company profile
Ibrahim Fibres Limited is a public limited company. The principal activities of the company is to manufacture and sell polyester staple fiber and yarn.

