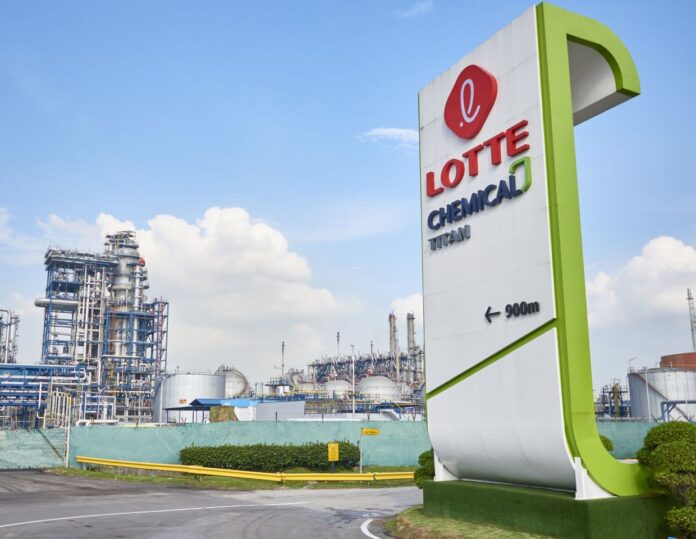
ISLAMABAD (ABC) – Lotte Chemical Pakistan Limited’s (LCPL’s) revenue dropped 18.6% to Rs81.6 billion during the calendar year 2023 compared with a revenue of Rs100.26 billion in CY22 with the decline resulting from reduction in volumes sold during the period, reports WealthPK.
| Lotte Chemical Pakistan Limited – Profitability – CY22 vs CY23 | |||
| Particulars | CY22 | CY23 | Percentage Change |
| Revenue | 100,265,555,000 | 81,619,405,000 | -18.6% |
| Gross profit | 17,824,211,000 | 10,244,570,000 | -42.52% |
| Operating profit / (loss) | 15,870,478,000 | 8,480,699,000 | -46.56% |
| Net Profit/Loss after tax | 10,118,471,000 | 5,077,654,000 | -49.8% |
LCPL reported a gross profit of Rs10.24 billion, 42.52% lower than Rs17.8 billion in CY22. Likewise, the operating profit plunged by 46.56%.
Additionally, the net profit plunged to Rs5.07 billion, representing a 49.8% reduction from the previous year.
Quarterly analysis
During the first quarter of CY23, the company posted revenue of Rs22.1 billion. The gross profit stood at Rs4.4 billion and the before-tax profit at Rs3.78 billion during 1QCY23. The company registered a net profit of Rs2.54 billion.
However, the second quarter saw revenues decline to Rs16.4 billion, gross profit to Rs2 billion, profit-before-tax to Rs2.09 billion and after-tax profit nosedived to Rs311.37 million as a result of decline in oil prices amid slow economic activity at home and abroad.
Furthermore, shortage of raw material forced the company to halt its operations temporarily during this period.
| Lotte Chemical Pakistan Limited – Profitability | ||||
| Particulars | Q1CY23 | Q2CY23 | Q3CY23 | Q4CY23 |
| Revenue | 22,112,698,000 | 16,429,866,000 | 23,592,757,000 | 19,484,084,000 |
| Gross Profit | 4,438,985,000 | 2,000,212,000 | 3,416,933,000 | 388,440,000 |
| Profit before tax | 3,782,610,000 | 2,094,205,000 | 3,214,942,000 | 416,310,000 |
| Net Profit after tax | 2,542,357,000 | 311,372,000 | 1,986,549,000 | 237,376,000 |
The third quarter observed a significant recovery in revenue, gross profit, and profit before and after tax due to higher fuel demand. However, the company witnessed a decrease in the financial indicators during 4QCY23 resulting from the surge in energy prices, decreased demand and the crisis in the Middle East.
Financial performance 2018-23
The after-tax profit grew from Rs4.4 billion in 2018 to Rs5.07 billion in 2023. The company posted the highest net profit of Rs10.1 billion in 2022 and the lowest of Rs2.12 billion in 2020.
| Lotte Chemical Pakistan Limited – Historical trend | ||||||
| Year | 2018 | 2019 | 2020 | 2021 | 2022 | 2023 |
| Profit after taxation (Mn) | 4,431 | 5,360 | 2,125 | 4,643 | 10,118 | 5,078 |
| EBITDA (Mn) | 7,697 | 9,166 | 4,416 | 8,810 | 18,941 | 12,270 |
The chemical company’s earnings before interest, taxes, depreciation and amortisation (EBITDA) followed a similar pattern. Starting from Rs7.69 billion in 2018, the company faced a dip to Rs4.4 billion in 2020, but recovered to the highest of Rs18.9 billion in 2022, showcasing lower operational costs and growing profit. However, EBITDA slipped to Rs12.27 billion in 2023, representing lower profit generation from operations and hurdles in cash flows during the year.
Ratio trend
The current ratio assesses how well a business can pay its short-term debts with its current assets. The current ratio reached its peak point of 2.34 in 2020 with the company consistently maintaining this ratio above 1, indicating a lower risk to meet obligations.
The interest coverage ratio measures how profitable a business must be to pay interest on its liabilities. A higher interest cover ratio indicates a better ability to finance interest payments and less than 1.5 is deemed hazardous. The interest cover ratio for the chemical company remained above 1.5 from 2018 to 2023, indicating its improved financial standing. However, this ratio kept a downward trend.
| Lotte Chemical Pakistan Limited – Ratio Trend | ||||||
| Year | 2018 | 2019 | 2020 | 2021 | 2022 | 2023 |
| Current Ratio | 1.8 | 1.88 | 2.34 | 1.83 | 1.85 | 1.71 |
| Interest cover | 225.63 | 29.69 | 12.44 | 27.88 | 55.75 | 32.6 |
| Debt equity ratio | 1.01 | 1.12 | 1.19 | 1.09 | 1.08 | 1.05 |
| Market capitalization (000) | 25,574,960 | 21,229,190 | 22,803,960 | 20,684,070 | 39,217,970 | 40,868,450 |
A debt-to-equity ratio of more than 1 indicates that most of the company’s assets are financed through borrowing and less than 1 means assets are financed through shareholders’ equity. The chemical maker’s debt to equity ratio has remained above 1 over this period, indicating assets financing through borrowing. The company recorded the highest value of 1.19 debt-equity ratio in 2020 and the lowest of 1.01 in 2018.
The market capitalisation determines the total market value of all outstanding shares. Overall, the company observed a continuous decline in its market capitalisation from Rs25.57 billion in 2018 to Rs20.68 billion in 2021. However, the following years 2022 and 2023 posted an impressive spike to Rs39.2 billion and Rs40.8 billion, respectively.
Company profile
Lotte Chemical Pakistan was established on May 30, 1998. The core activity of the company is to manufacture and sell pure terephthalic acid (PTA).

